I built both CPython 3.15 binaries and ran 6 experiments to find out if free-threaded Python is ready
I wanted a straight answer. Free-threaded Python has been shipping since 3.13, Python 3.15 is in alpha, and the discourse has been alternately breathless and dismissive. Rather than read more opinions, I compiled both CPython 3.15.0a8+ builds (one standard, one with --disable-gil) on the same 8-core Linux machine and ran six benchmarks. This is what I found.
The thing that surprised me first
Before setup or theory: 71% of writes silently disappeared.
I ran 8 threads each doing 200,000 increments on a shared counter. Expected final value: 1,600,000. Here's what I got:
| Build | Trial 1 | Trial 2 | Trial 3 | Avg lost |
|---|---|---|---|---|
| GIL | 1,600,000 | 1,600,000 | 1,600,000 | 0% |
| no-GIL | 460,316 | 452,040 | 456,169 | ~71% |
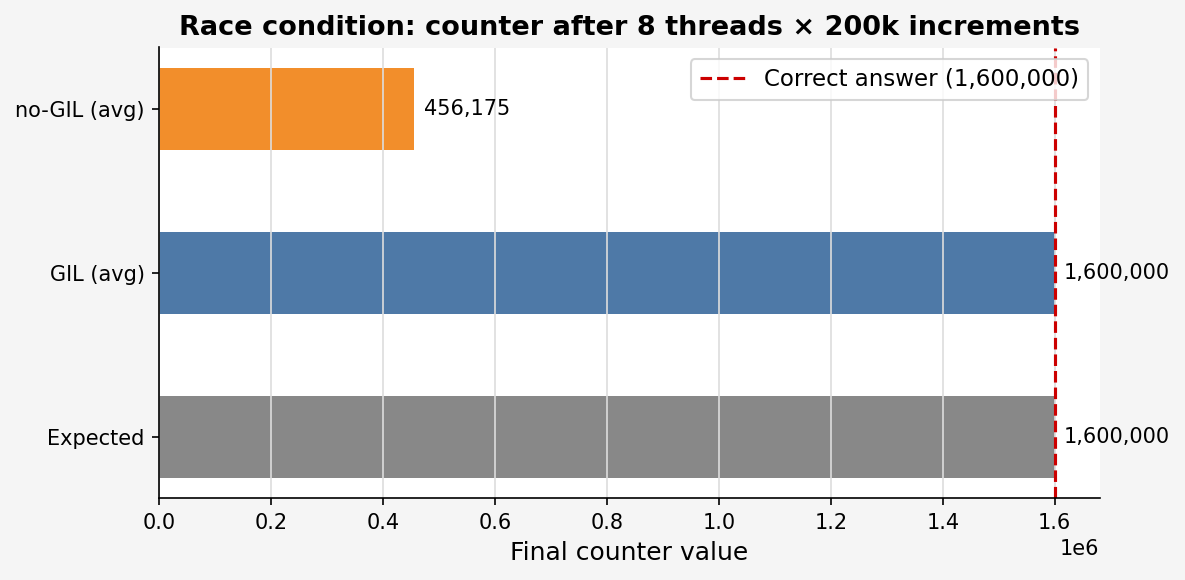
The GIL build gets the right answer every time. The no-GIL build loses nearly three quarters of its updates.
The reason: counter[0] += 1 looks like one operation but compiles to three bytecode instructions: LOAD, BINARY_OP, STORE. Under the GIL, only one thread can execute Python bytecode at a time; so even if a thread switch happens between the LOAD and the STORE, the other thread blocks on the GIL rather than running concurrently. Without it, all 8 threads execute truly simultaneously, thousands of LOADs read the same stale value, and thousands of STOREs write back the same wrong result.
The uncomfortable implication: code that has run correctly for years under the GIL may be quietly broken without it. I'll come back to this at the end.
What the GIL is and why it matters
CPython has always had a Global Interpreter Lock: a mutex that lets only one thread execute Python bytecode at a time. It exists because CPython's memory management uses reference counting, and reference counts are not thread-safe without it. The GIL made everything thread-safe without requiring every object to carry its own lock, a pragmatic tradeoff that worked well for a long time.
The cost is that threads in Python never truly run in parallel on CPU-bound work, regardless of how many cores you have. The standard answer has been "use multiprocessing instead": spawn separate processes, each with its own interpreter and its own GIL. That works, but processes are expensive to spawn, can't share memory easily, and add real complexity for what should be a simple parallelism story.
Python 3.13 shipped the first experimental answer: a free-threaded build compiled with --disable-gil. Remove the lock, give each object atomic reference counting and per-object mutexes, and let threads actually use multiple cores. The benchmarks below measure what that trade looks like in practice.
The three PEPs that got us here
Three PEPs form the foundation. Understanding them explains why the experiments produce the numbers they do.
PEP 683: Immortal Objects (Python 3.12)
This one came before the GIL removal work and is part of what makes it feasible. The idea: mark objects like None, True, False, small integers, interned strings, and built-in types as immortal at interpreter startup. When an object is immortal, Py_INCREF and Py_DECREF are no-ops.
Why does this matter for threading? None appears in almost every piece of Python code. Without immortalisation, every thread touching None would be contending on its reference count, a massive source of atomic memory traffic. Immortalisation removes that contention entirely.
There's a bonus for server deployments: processes that fork after interpreter startup no longer dirty memory pages containing None and similar singletons, improving copy-on-write efficiency and reducing resident memory across worker processes.
PEP 684: A Per-Interpreter GIL (Python 3.12)
Rather than removing the GIL, PEP 684 makes it per-interpreter: each PyInterpreterState gets its own lock. Multiple sub-interpreters inside the same process can then run truly in parallel.
This matters most for embedding scenarios and frameworks where you could run workers as sub-interpreters sharing a process address space instead of as separate processes; less memory, faster startup, same isolation. The tradeoff compared to PEP 703 is that sub-interpreters cannot share Python objects across their boundaries. Each interpreter has its own heap. It's the conservative path.
PEP 703: Making the GIL Optional (Python 3.13+)
This is the core proposal. Sam Gross spent years on a fork called "nogil-3.9" before bringing it upstream. The interesting part isn't "remove the GIL"; anyone can remove a lock. The interesting part is recovering the performance you lose when you do.
Biased Reference Counting is the biggest mechanism. Each object tracks an owning thread. The owning thread uses cheap non-atomic increments and decrements; other threads fall back to atomic operations only when they need to touch an object they don't own. This recovers most of the single-thread overhead that a naive "make everything atomic" approach would cost.
Deferred Reference Counting takes it further: functions, code objects, and modules skip stack-based refcounting entirely. They're tracked by the garbage collector and freed at collection time. This matters because these objects are touched constantly.
Mimalloc replaces CPython's internal pymalloc with Microsoft's mimalloc allocator, designed specifically for high-throughput multi-threaded workloads. The old allocator had a global lock; mimalloc doesn't need one.
Per-Object Locking replaces the global lock for container operations. list.append() and dict.__setitem__() now hold a lightweight per-object mutex rather than the process-wide GIL.
Optimistic Lock-Free Reads let lists and dicts serve reads without taking any lock at all, using an RCU-like technique that falls back to locking only when a concurrent write is detected mid-read.
Stop-the-World GC is the unavoidable cost. The cyclic garbage collector has to pause all threads during collection to get a consistent view of reference counts. For most programs this is infrequent enough to be invisible.
How the three fit together:
PEP 683 (3.12)           PEP 684 (3.12)              PEP 703 (3.13+)
Immortal objects    +    Per-interpreter GIL    =    Remove GIL entirely
(eliminate refcount       (parallel interpreters,      (parallel threads,
 churn on builtins)        isolated heaps)              shared heap)
PEP 683 is the foundation the other two build on. PEP 684 and PEP 703 are two different strategies for CPU parallelism: one safe and conservative, the other powerful and requiring care.
How I built both Pythons
Running on CPython 3.15.0a8+, WSL2, x86_64, 8 logical cores.
Prerequisites:
sudo apt-get install -y build-essential libssl-dev zlib1g-dev libbz2-dev \
  libreadline-dev libsqlite3-dev libffi-dev liblzma-dev pkg-config
GIL build (standard):
./configure --enable-optimizations --prefix=$HOME/python-gil
make -j$(nproc)
make install
Free-threaded build:
make distclean
./configure --disable-gil --enable-optimizations --prefix=$HOME/python-nogil
make -j$(nproc)
make install
--enable-optimizations enables Profile-Guided Optimisation: the compiler builds an instrumented version, runs the test suite to collect real execution profiles, then recompiles using that data. The result is a binary where the compiler knows which branches are hot and which functions to inline. Also enables LTO across object files. Typical payoff is 10–20% faster interpreter, at the cost of a build that takes 2–4× longer. Worth it for benchmarking.
Verify:
python3 -c "import sys; print(sys._is_gil_enabled())"
# GIL build    -> True
# no-GIL build -> False
A note on timing in WSL2: time.time() is not safe for benchmarking in WSL2. The virtual clock can jump when the Windows host syncs via NTP, producing impossible negative elapsed times. All experiments use time.perf_counter() instead, which reads the monotonic hardware performance counter and is unaffected by clock adjustments.
The six experiments
Experiment 1: Single-threaded baseline
Before threads enter the picture, what does the no-GIL build cost on a single core? Total work matches the 8-thread experiments: 80 million loop iterations.
def cpu_task(n):
    x = 0
    for _ in range(n):
        x += 1

start = time.perf_counter()
cpu_task(80_000_000)
print(time.perf_counter() - start)
| Build | Time |
|---|---|
| GIL | 1.2979s |
| no-GIL | 1.3993s |
~8% slower on a single core. Without the GIL, object mutation requires atomic CPU instructions (LOCK XADD or equivalent) to safely update reference counts. These cost more than the non-atomic versions the GIL previously made safe. Biased reference counting limits the damage but can't eliminate it.
If your codebase is predominantly single-threaded, free-threaded Python will be a small step backward. That's the honest answer.
Experiment 2: I/O-bound threads
Before attributing all thread problems to the GIL, it's worth confirming what it actually blocks. 50 threads, each sleeping 100ms, simulating concurrent network or disk waits.
def io_task():
    time.sleep(0.1)

threads = [threading.Thread(target=io_task) for _ in range(50)]
# start all, join all
| Build | Time |
|---|---|
| GIL | 0.1112s |
| no-GIL | 0.1141s |
Both finish in ~110ms. CPython releases the GIL during system calls. time.sleep(), socket reads, file reads, network operations; all drop the GIL before entering the kernel and reacquire it after. Threads waiting on I/O were already running in parallel even with the GIL. This is why async/await and threaded web frameworks have been performant for years despite the lock. The GIL only blocks CPU-bound bytecode execution.
If your bottleneck is I/O, free-threaded Python will not help.
Experiment 3: Race condition (unsynchronised shared counter)
This is the one I led with. Full details: 8 threads, 200,000 increments each, expected 1,600,000.
counter = [0]

def unsafe_inc():
    for _ in range(200_000):
        counter[0] += 1    # looks atomic, isn't

threads = [threading.Thread(target=unsafe_inc) for _ in range(8)]
| Build | Trial 1 | Trial 2 | Trial 3 | Avg lost |
|---|---|---|---|---|
| GIL | 1,600,000 | 1,600,000 | 1,600,000 | 0% |
| no-GIL | 460,316 | 452,040 | 456,169 | ~71% |
Any shared mutable state that isn't explicitly protected by a lock is suspect the moment you switch to a free-threaded build.
Experiment 4: Multiprocessing
Multiprocessing has been the GIL workaround for CPU-bound work for a long time. This establishes the baseline to compare against free-threaded threads.
from multiprocessing import Process

procs = [Process(target=cpu_task, args=(10_000_000,)) for _ in range(8)]
# start all, join all
| Build | Time |
|---|---|
| GIL | 0.3879s |
| no-GIL | 0.4432s |
Both builds achieve real parallel speedup (compare to ~1.3s single-threaded for the same total work). Each process has its own interpreter and its own GIL; they never compete. The cost is process spawn overhead, separate memory spaces, and serialisation to pass data between workers.
Free-threaded Python's value proposition is making threads as fast as processes for CPU work, while keeping shared memory.
Experiment 5: Thread scaling
The clearest demonstration of what the GIL actually does to threaded workloads. I doubled the thread count from 1 to 8 and watched what happened to wall time.
for n_threads in [1, 2, 4, 8]:
    threads = [threading.Thread(target=cpu_task, args=(10_000_000,))
               for _ in range(n_threads)]
    # time start to join all
| Threads | GIL | no-GIL | no-GIL speedup |
|---|---|---|---|
| 1 | 0.1714s | 0.1848s | 0.93× |
| 2 | 0.3152s | 0.1842s | 1.71× |
| 4 | 0.6471s | 0.2100s | 3.08× |
| 8 | 1.3706s | 0.3373s | 4.06× |
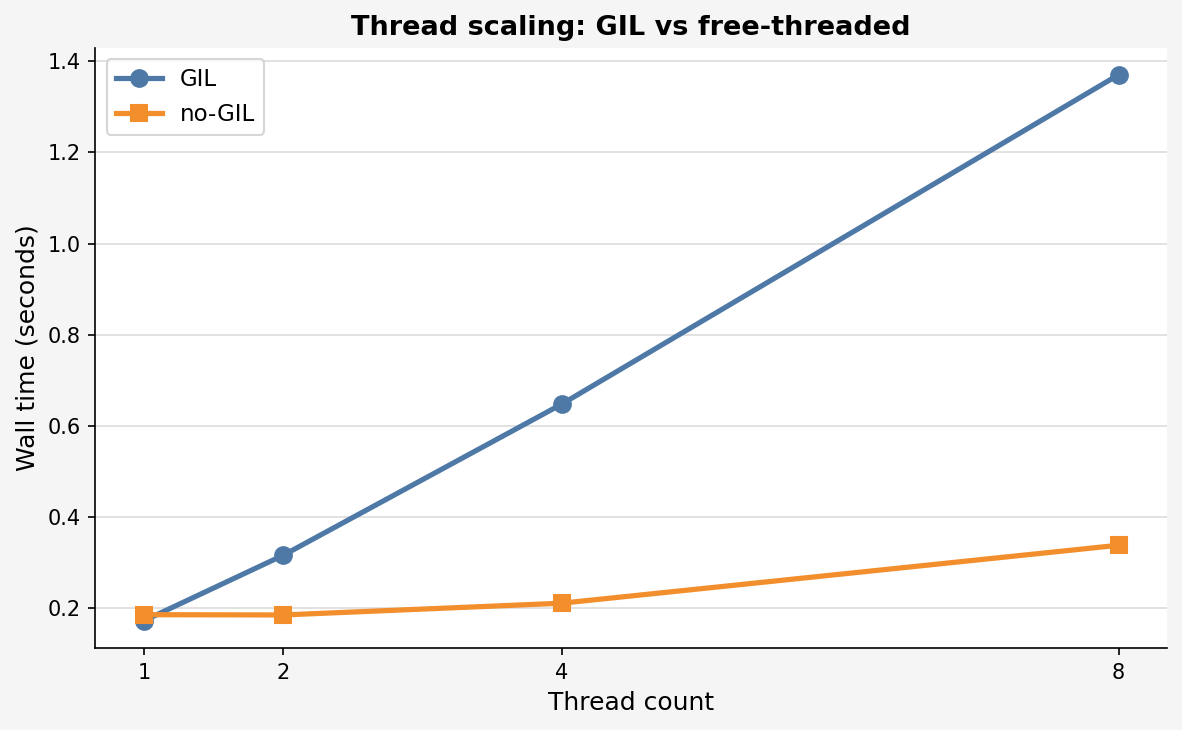
The GIL build gets slower as you add threads. Only one thread runs at a time, so 8 threads doing 10 million iterations each means 80 million iterations of sequential work plus switching overhead. It's worse than a single thread.
The no-GIL build stays nearly flat. All 8 threads spread across cores and run simultaneously. Ideal linear scaling would give 8×; I measured ~4×. The gap comes from scheduling jitter, memory bus contention between cores, and WSL2 sharing cores with the Windows host. On dedicated bare-metal hardware the scaling would be tighter.
Experiment 6: Correctly locked shared state
The natural fix for the race condition is a lock. This measures what that costs.
lock = threading.Lock()
counter = [0]

def safe_inc():
    for _ in range(200_000):
        with lock:
            counter[0] += 1

threads = [threading.Thread(target=safe_inc) for _ in range(8)]
| Build | Time | Correct |
|---|---|---|
| GIL | 0.1141s | True |
| no-GIL | 1.2500s | True |
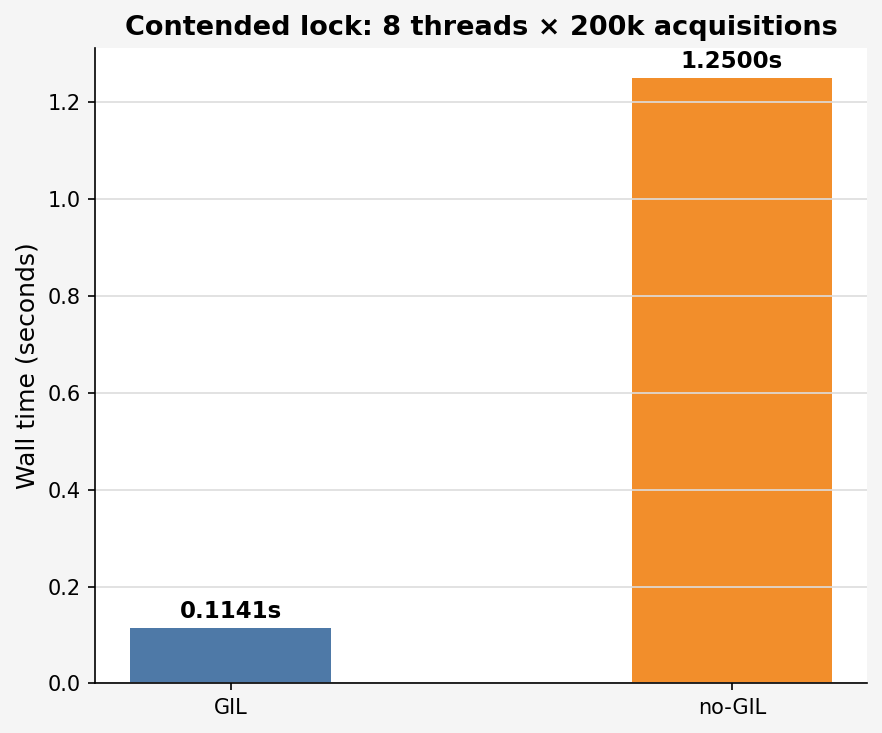
Both correct. no-GIL is 10× slower.
Under the GIL, acquiring a threading.Lock is almost free. The GIL is already serialising threads, so the lock's OS mutex is almost never actually contended. Without the GIL, all 8 threads are genuinely racing to acquire the mutex. Every with lock: becomes a real pthread_mutex_lock / pthread_mutex_unlock call. At 1.6 million total acquisitions across 8 threads, the kernel is doing serious work.
This is probably the most practically important result. A lot of Python code, especially in libraries, uses locks for correctness in situations where the GIL was already protecting things for free. Under no-GIL those locks become real costs. Tight loops with a single shared lock are an anti-pattern. Better alternatives: per-thread accumulators that merge at the end, queue.Queue, or collections.deque, which use finer-grained internal locking.
Results summary
| Experiment | GIL | no-GIL | Winner |
|---|---|---|---|
| Single-thread (80M ops) | 1.2979s | 1.3993s | GIL (+8%) |
| I/O-bound (50 threads) | 0.1112s | 0.1141s | Tie |
| Race condition (safety) | 0% lost | ~71% lost | GIL (safer) |
| Multiprocessing (8 proc) | 0.3879s | 0.4432s | GIL (faster) |
| CPU threads (8 threads) | 1.3706s | 0.3373s | no-GIL (4×) |
| Contended lock | 0.1141s | 1.2500s | GIL (10×) |
Where I'd actually use it
The benchmarks above are intentionally synthetic. Here's where the speedup would translate to something I'd actually ship.
ML model inference serving. Concurrent requests, each needing a forward pass. With the GIL those requests serialise even with threads. With free-threaded Python a thread pool can run inference truly in parallel; especially relevant for pure-Python models and post-processing steps.
Data pipeline processing. ETL fan-out: read a batch, split into chunks, transform in parallel, merge results. With multiprocessing this requires pickling data across process boundaries. With free-threaded threads you keep shared memory; no serialisation overhead for large in-memory datasets.
Scientific computing with Python-level parallelism. NumPy and SciPy release the GIL during C-level operations, so those already benefit from threads. The Python-level glue code between calls doesn't. Free-threaded Python parallelises the parts that were left behind.
Real-time audio and video processing. Frame-by-frame processing is embarrassingly parallel. A thread pool over free-threaded Python is a natural fit and avoids the IPC overhead of sending frame data across process boundaries.
Web scraping and HTML parsing at scale. Scraping is often I/O-bound, but the parsing step (HTML parsing, regex extraction, data cleaning) is CPU-bound and can dominate at scale. Thread pools become viable without the GIL.
Financial simulations and Monte Carlo methods. Each simulation path is independent. Free-threaded Python opens the door to thread pools with shared access to parameter arrays without copying data into each process.
My verdict
Use free-threaded Python when your work is CPU-bound, naturally parallel, and doesn't require heavy shared state between threads. If you're computing the same function on independent inputs and collecting results, threads will scale close to linearly with your core count. It's also a good replacement for multiprocessing where IPC overhead or pickling complexity is a real cost.
Stick with the GIL build when your code is single-threaded (measurably slower, no upside), I/O-bound (the GIL already releases during I/O), or you have heavily contended locks in tight loops.
What I'd do before migrating any existing codebase:
- Audit every variable or data structure that more than one thread can write. If it's not protected by an explicit lock, it's unsafe.
- Watch for
x += 1on shared state. It looks like one operation. It isn't. - Replace hot contended locks in tight loops with per-thread accumulators and a final merge step.
- Benchmark your single-threaded code paths. Profile before and after.
- Use
threading.local()for state that is logically per-thread but currently stored as a module-level variable.
The 4× thread scaling result is real and compelling. So is the 71% write loss. Both are true at the same time. Free-threaded Python isn't a free upgrade; it's a different set of tradeoffs, and the ones you care about depend entirely on what your code does.